
Which metrics should you track to operate a screen network?
Availability, content freshness, schedule coverage and incidents: discover the useful metrics for managing a digital signage network.
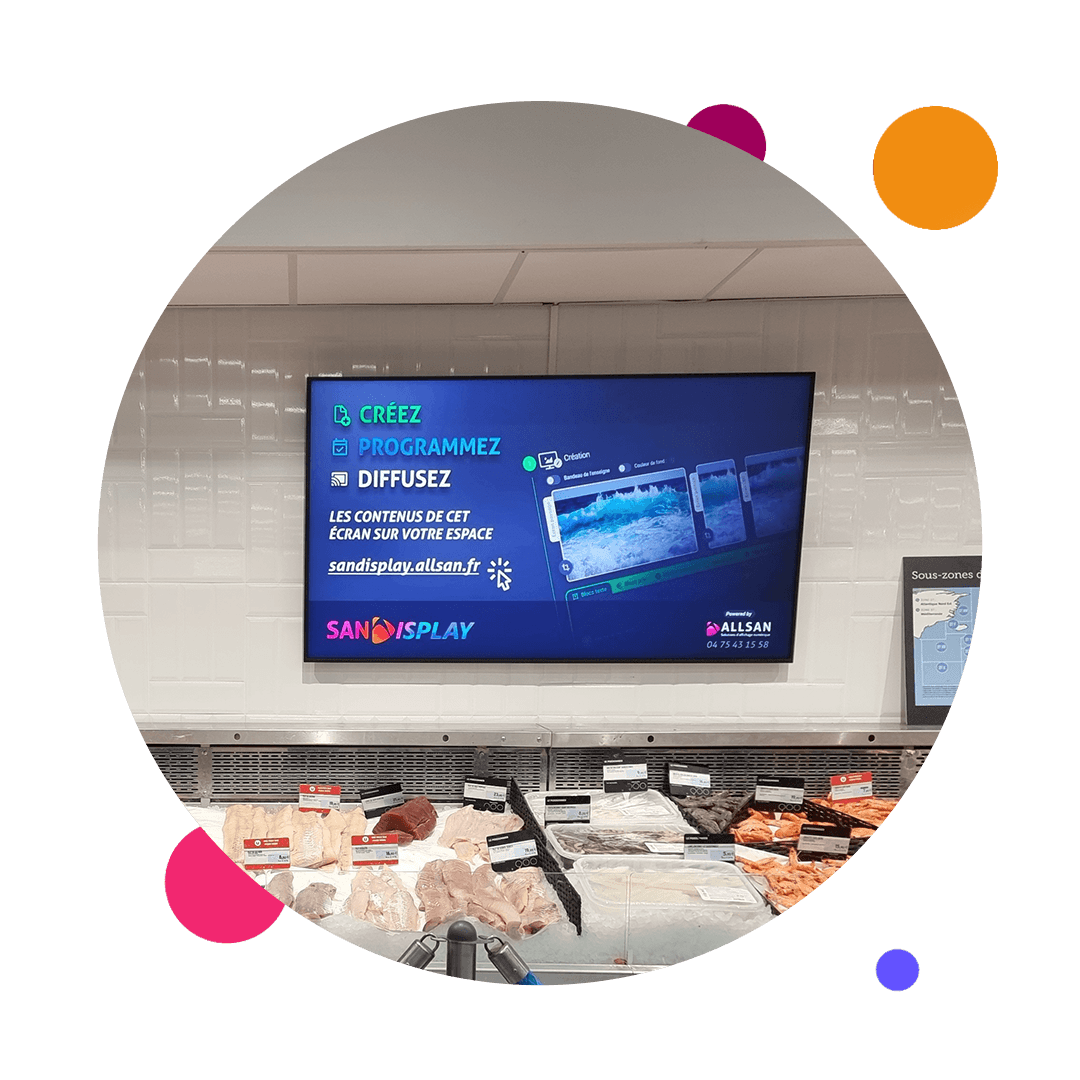
Operating a digital signage network involves more than publishing media. You need to know whether the expected screens are displaying, whether campaigns remain relevant and whether incidents are being handled at the right level. Without shared metrics, teams may discover a problem on site or leave outdated content running. However, a useful dashboard should not collect every piece of available data. Its primary purpose is to highlight situations that require a decision or a practical response.
Start with operational objectives
The right metrics depend on the network’s purpose. Screens in stores may present offers, services and local information. In a company, they may inform employees or welcome visitors. In both cases, monitoring should answer three questions: is the system available, is the right content scheduled and can someone intervene when an issue arises? This approach prevents teams from confusing data volume with operational control. It complements the management provided by digital signage software such as SanDisplay.
Five groups of metrics to monitor
- Network availability: the number of expected screens or playback points that are active, unavailable or require verification. The reference scope must remain current to prevent false discrepancies.
- Schedule coverage: screens with a valid schedule for the relevant period, campaigns nearing their end date and time slots with no planned content. This metric supports anticipation rather than correction after the event.
- Editorial freshness: content approaching expiry, local information requiring review and media with no identified owner. A technically valid schedule may still have become irrelevant or inconsistent.
- Open incidents: detection date, priority, affected site, person responsible for follow-up and next action. The age of an incident is often more informative than the total number of incidents.
- Reference data quality: alignment between installed screens, their location, orientation, purpose and local owner. Effective monitoring of professional displays begins with a reliable inventory.
Do not confuse technical status with correct playback
A device shown as available does not prove on its own that the intended message is visible. Conversely, a temporary lack of information in a management tool does not necessarily mean the screen is black. Each status therefore needs a clear definition: connection of the playback point, schedule validity, availability of required media and, where appropriate, a visual check on site. The possibilities depend on the chosen architecture and the information that can actually be accessed. Clear definitions prevent an ambiguous metric from generating false alerts or concealing an editorial issue.
Build an action-oriented dashboard
- Define the expected network: sites, screens, locations, uses and normal operating periods. This baseline determines what genuinely needs to be supervised.
- Set priorities: a reception screen, essential internal information and a promotional display may not require the same response time.
- Assign every discrepancy: the central team may correct scheduling while a local contact checks power, visible playback or the screen’s immediate environment.
- Record a next action: every issue should state what will be done, by whom and when. A status without an owner soon becomes just another reporting line.
- Review the rules regularly: adding a site, moving a screen or changing its purpose should trigger an update to the reference data and monitoring criteria.
Tailor information to each team’s role
Senior management does not need the same detail as the team operating the network every day. A summary may show overall availability, priority incidents and campaigns requiring renewal. Operational teams need a site-by-site and screen-by-screen view with pending actions. Local managers should receive only the checks they are able to perform. This segmentation reduces noise and avoids sending every issue to everyone. It also makes operational reviews involving communications, IT, maintenance and field teams more effective.
Establish a simple operating routine
A dashboard creates value only when it is part of a routine. Frequent checks can focus on high-priority discrepancies and content approaching expiry. A broader periodic review can examine recurring incidents, inventory quality and upcoming campaigns. Following any significant change, the result should be checked on the affected screens. SanDisplay enables teams to create, schedule, distribute and supervise content across a screen network remotely. The internal organisation surrounding the software then turns that capability into a sustainable operating process.
Which pitfalls should you avoid?
The first pitfall is tracking too many metrics without defining the decisions linked to them. The second is measuring technical status alone while overlooking content relevance. Finally, an overall rate can conceal a site that has been struggling for a long time. Teams should retain the ability to drill down to the affected device without imposing that level of detail on every reader. A small set of understood, assigned and regularly reviewed metrics is more valuable than exhaustive reporting that triggers no action.
Move from reporting to operational control
An effective monitoring framework connects every screen to a purpose, every item of content to a period and every issue to an owner. This method speeds up decisions and helps maintain consistent communication over time. To define metrics suited to your organisation and explore how SanDisplay could support your network, you can discuss your digital signage project with ALLSAN.